Good morning, Sports fans! Davey Mac here with a Super Bowl edition of the Sports Report for ya! And we’re getting into the stats of the game itself! Super Bowl LVIII is nearly upon us and you should check some of these stats out…especially if you’re putting some money on the game! So let’s look at the numbers of Big Game:

KANSAS CITY, MO – JANUARY 12: Patrick Mahomes #15 of the Kansas City Chiefs points to the sidelines in celebration after throwing a touchdown against the Kansas City Chiefs during the first quarter of the AFC Divisional Round playoff game at Arrowhead Stadium on January 12, 2019 in Kansas City, Missouri.
1. Six: Number of Super Bowl appearances by the Kansas City Chiefs, counting this year’s game. (3 wins.)
2. Eight: Number of Super Bowl appearances by the San Francisco 49ers. (5 wins.)
3. One: Previous Super Bowl meeting between Chiefs and Niners. Super Bowl 54 . . . Chiefs won 31 to 20.
4. 71,835: Number of fans expected at Allegiant Stadium.
5. $1.1 billion: Expected boost to the local economy.
6. $275: Projected spending per Super Bowl tourist on food and drinks over four days.

SANTA CLARA, CALIFORNIA – JANUARY 22: Brock Purdy #13 of the San Francisco 49ers looks to pass against the Dallas Cowboys during the first quarter in the NFC Divisional Playoff game at Levi’s Stadium on January 22, 2023 in Santa Clara, California.
7. $299: Lowest daily hotel rate in the area.
8. $10,752: Average price of a ticket on the resale market.
10. 35%: Percentage of people who say they’d give up drinking for a year to attend the Super Bowl in person.
11. 14: Number of people who attend the average Super Bowl party.

FRANKFURT AM MAIN, GERMANY – NOVEMBER 05: Travis Kelce #87 of the Kansas City Chiefs warms up prior to the NFL match between Miami Dolphins and Kansas City Chiefs at Deutsche Bank Park on November 05, 2023 in Frankfurt am Main, Germany.
12. 112.2 million: Number of people who will either throw or attend a Super Bowl party.
13. 1.45 billion: Number of chicken wings that will be eaten. Also, 10 million pounds of ribs, 11.3 million pounds of potato chips, and 250 million pounds of avocados.
14. 35%: Increase in pizza orders.
15. 50 million cases: Amount of beer sold.
16. 90%: How much more beer is consumed on Super Bowl Sunday than the average day.
17. 18.8 million: Number of people who will miss work the day after the game, resulting in $9.2 billion in lost productivity.
18. $1.3 billion: Amount that will be legally wagered on the game.

SANTA CLARA, CALIFORNIA – OCTOBER 08: George Kittle #85 of the San Francisco 49ers celebrates after a touchdown catch during the third quarter against the Dallas Cowboys at Levi’s Stadium on October 08, 2023 in Santa Clara, California.
So let’s get ready for some football action, baby! Enjoy the game, everyone!

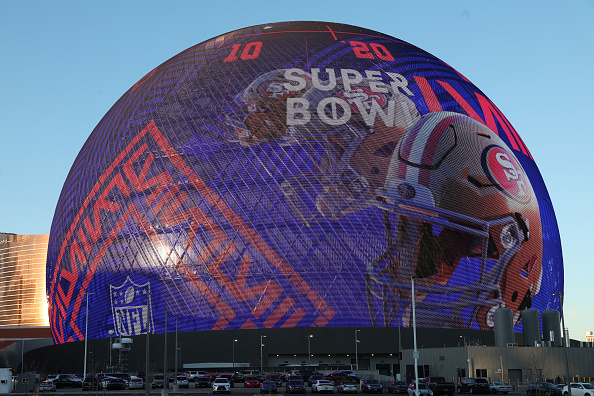
LAS VEGAS, NEVADA – FEBRUARY 08: The Sphere on the Las Vegas Strip is seen displaying Super Bowl LVIII signage ahead of Super Bowl LVIII on February 08, 2024 in Las Vegas, Nevada.


